G&G Graph Library
Last update=12 June, 2023
A number of graph files are available. See also the G&G overview, where pictures of many of these graphs are shown. If you have interesting graphs/digraphs/groups, please consider posting them on this website. Examples are strongly regular graphs, distance regular graphs, incidence graphs of finite geometries or BIBDs, catalogs of cubic graphs, quartic graphs, torus maps, transitive graphs, etc. Send them by e-mail, together with any additional information that may be useful.
The "Draw Symmetric" command in G&G can be used to produce interesting drawings of graphs. Click for an example illustrating 4 very different-looking symmetric views of Q4, the 4-cube.
G&G text format for graphs
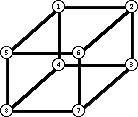
Graphs are stored in the G&G ascii format. The graph of the cube is used as an example.

&Graph
Cube
8
120 64 327 256
-1 2 4 5
-2 3 6
-3 4 7
-4 8
-5 6 8
-6 7
-7 8
0
The $ symbol is used to separate graphs stored in a single file. The second line indicates that a graph follows. The third line is the name of the graph. The fourth line is the number n of vertices. The vertices are numbered 1..n. The fifth line is the bounding rectangle of the window in which the graph is drawn. Then vertex 1 is indicated by -1. Its adjacent points follow. Vertex 2 is indicated by -2, then its adjacent points, etc. The end of the list is indicated by 0.
Graphs in this format are very easily input.
- read(u)
- while u<0 begin
- u = -u
- read(v)
- while v>0 begin
- AddEdge(u,v)
- read(v)
- end
- u = v
- end
The graph adjacencies can be followed by the (h,v)-coordinates of the vertices. These are the horizontal and vertical offsets from the top left corner of the window. For the example above, coordinates appear as follows.
&Coordinates-1 211 14
-2 301 14
-3 301 89
-4 211 89
-5 146 74
-6 236 74
-7 236 149
-8 146 149
Additional optional information can also be included, such as the colour of the vertices, and a renaming of the points. Save some graphs in text format using G&G to see the format used.

Note: Some files were lost as a result of a disk crash in March, 2018. They are being regenerated.
Download:
![]() The
Vertex-Transitive Graphs up to
19 vertices (updated May 7/18). Click for some pictures of vertex-transitive graphs.
The
Vertex-Transitive Graphs up to
19 vertices (updated May 7/18). Click for some pictures of vertex-transitive graphs.
![]() The connected cubic graphs on 10 points (submitted by R. Figuero) (updated May 1/18)
The connected cubic graphs on 10 points (submitted by R. Figuero) (updated May 1/18)
![]() 4 views
of the Petersen graph, and 4 views of Q4, the 4-cube
4 views
of the Petersen graph, and 4 views of Q4, the 4-cube
![]() The Platonic polyhedra (updated May 1/18)
The Platonic polyhedra (updated May 1/18)
• Tetrahedron, cube, octahedron, dodecahedron, icosahedron, and their line graphs and truncations.
Also the graphs of the 5-cell, 8-cell, 16-cell, 24-cell, 120-cell, and 600-cell,
together with some derived graphs.
![]() Some strongly regular graphs (updated May 1/18)
Some strongly regular graphs (updated May 1/18)
• Schläfli, Shrikande, Clebsch, Hoffman-Singleton graphs, and two graphs on 26 vertices,
plus the strongly regular (12,5,6) graphs on 25 vertices.
![]() Incidence graphs of some projective planes
Incidence graphs of some projective planes
(updated May 3/18)
• PG(2,2), PG(2,3), PG(2,4), PG(2,5), PG(2,7), PG(2,8), PG(2,9)
and the Hall and Hughes planes of order 9
![]() Some non-hamiltonian graphs (updated May 1/18)
Some non-hamiltonian graphs (updated May 1/18)
• Grinberg, Thomassen, Tutte, Coxeter (3 views), Horton, Lederberg graphs. The
Grinberg, Tutte and Lederberg graphs are planar, 3-regular, 3-connected, non-hamiltonian graphs.
The Horton and Thomassen graphs are hypotraceable -- ie, they have no hamilton path,
but if any vertex is deleted, there is a hamilton path. The Coxeter graph has an
automorphism mapping any 3-path to any 3-path.
![]() Some of the cages (updated May 7/18)
Some of the cages (updated May 7/18)
(3,5), (3,6), (3,7), (3,8), (4,5), (4,6), (5,5), (7,5), and the (3,9)-cages.
• A (k,n)-cage is a minimal graph of degree k, with a smallest cycle of length n.
![]() The minor-order obstructions for the projective plane (updated May 30/18).
The minor-order obstructions for the projective plane (updated May 30/18).

